Inclusive Digital District Design and Mapping for Urban Areas

iNeighborhoods partners announce an inclusive and cost-effective, digital district mapping, design and ecosystem program for urban areas.
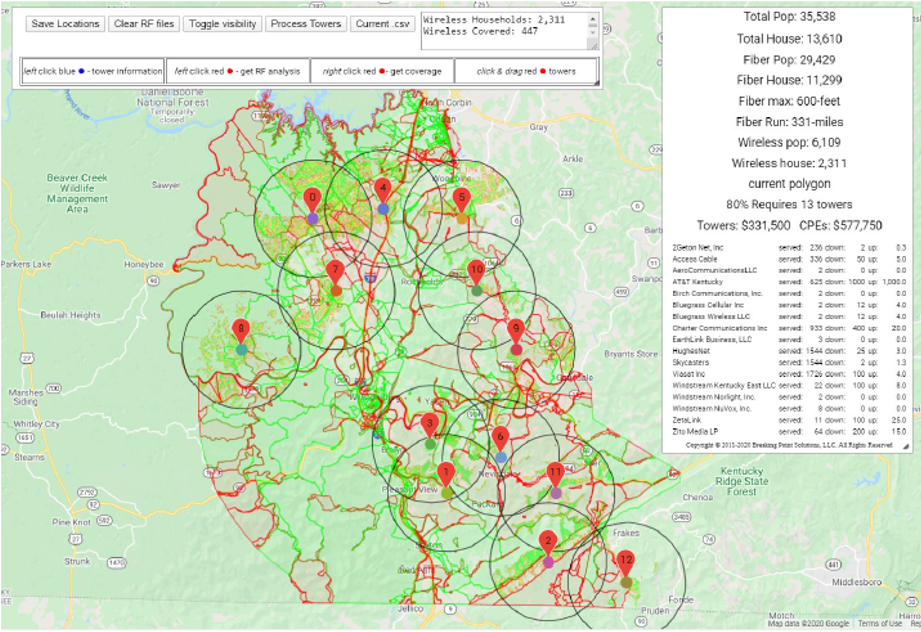
Our GIS mapping server quickly collects definitive location and performance data of wired and mobile wireless broadband connections in your urban city or neighborhood locations in the USA. Our program can also identify city locations which are under-served, under-perform or lack connectivity. Mapping data can then be ported to our GIS based network design tool which can produce cost effective network designs, business models and a budgetary parts list in a fraction of the time it would usually take. Say goodbye to traditional feasibility studies and a long decision-making process.
“As the coronavirus outbreak spreads and causes a series of disruptions to the economic, educational, medical, and civic life of our country, it is imperative that Americans stay connected. Broadband will enable them to communicate with their loved ones and doctors, telework, ensure their children can engage in remote learning, and—importantly—take part in the ‘social distancing’ that will be so critical to limiting the spread of this novel coronavirus.” – FCC Chairman Pai
The system is scalable and flexible. Depending upon the community engagement method, mapping can take place for areas as small as a single home, a building, a street, a block, a ward or district, a municipality, a city or a county. The design tool can then be used to focus on areas of interest or district.
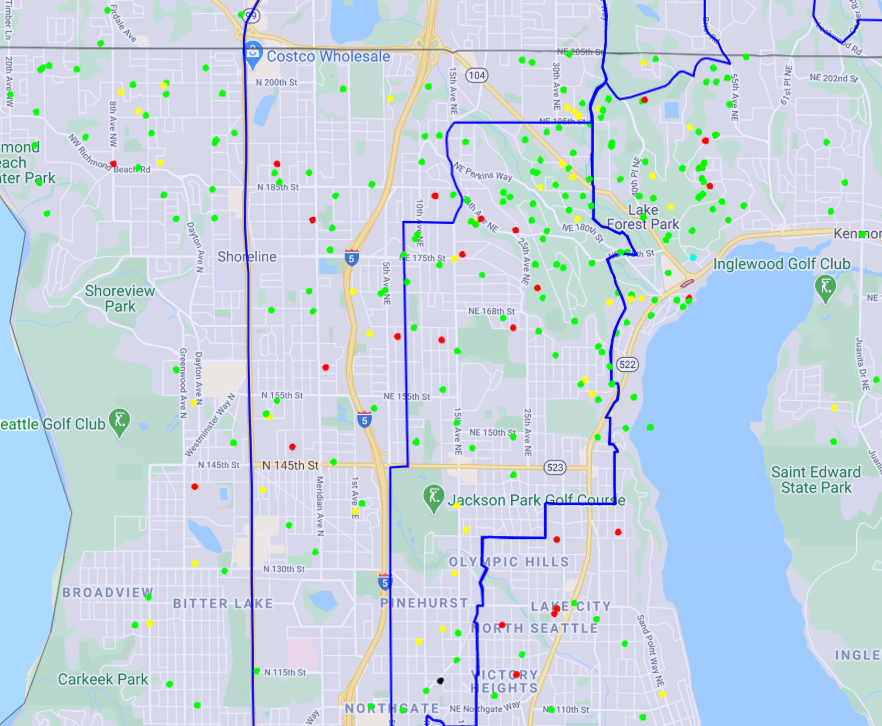
Summary performance roll-up data of local service provider networks can also be captured. Once all business and residential data has been collected, mapping data can be presented in a CSV format, a SQL data base format, or can displayed in Google Maps (as on this page), other GIS systems, or in an iNeighborhoods Story Map.
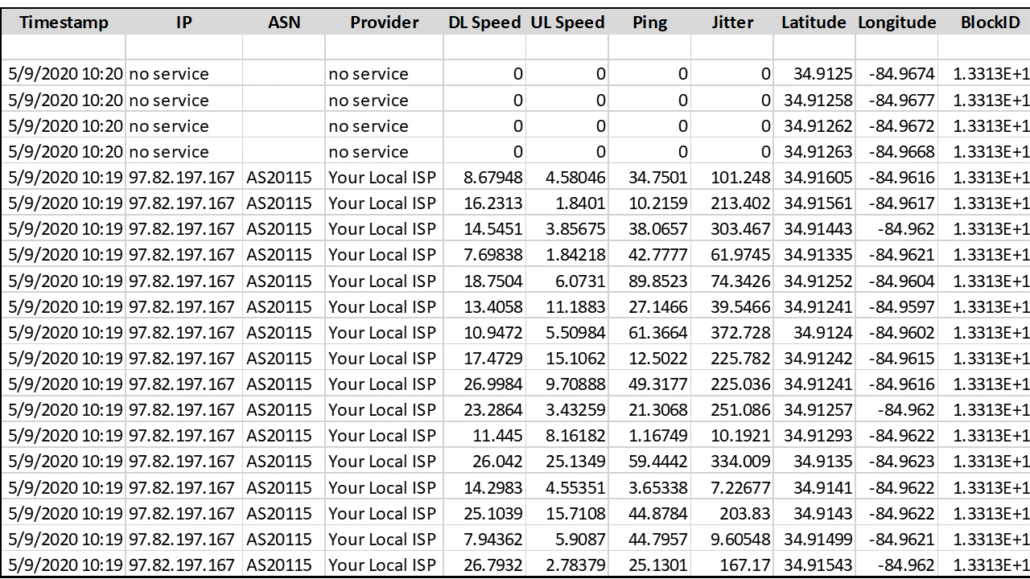
Mapping data is collected in the following format which includes twenty metadata fields:
When integrated with other iNeighborhoods ecosystem development services or workshops, social impact, educational opportunities, ecosystem growth and community revenue flows can be more effectively realized. In this way, stakeholders can quickly evaluate the degree of Internet connectivity and performance in their community.
Benefits of Digital District Mapping and Design
a) Identification of, and strategy development for, under-served or disadvantaged communities.
b) Prepare for the future of distance learning, telehealth, public health and working from home.
c) Work with your service providers to provide better connectivity and more bandwidth to your community.
d) Observe the aggregate performance of multiple service providers within, or across your community.
e) Valuable business case justification for Federal, State and local economic development grants.
f) Valuable business case justification for public and private sector investment.
e) Significant cost and time savings.
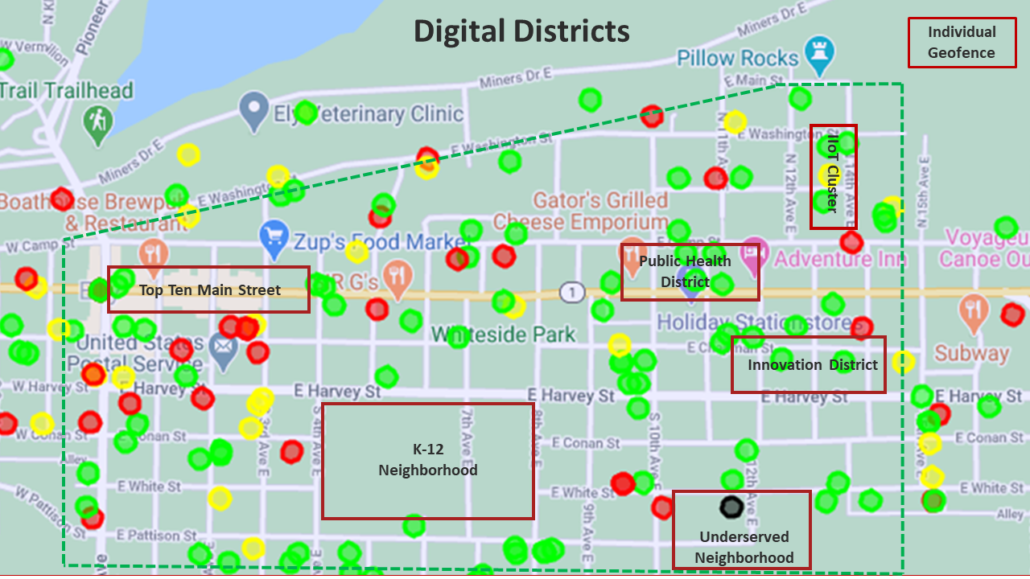
g) Evaluate synergistic locations for premium digital communities such as with Geofencing.
Digital Mapping Process
Our mapping process makes extensive use of community engagement. We will provide you with a mapping link that you can provide to your community, in the form of a community invitation or website. When the link is clicked, a mapping registration form will open and ask for the address location and a few other minor details – very easy. When finished, the mapping system will run a quick internet performance test to that location, save the performance data to our database, and then delete the address information. The privacy of your community is preserved.
Digital Mapping License
iNeighborhoods will provide you with a one-year license to use the mapping system. The license is renewable.
Digital Mapping Turnaround Time and Cost
The turnaround time is highly dependent upon your community engagement process and how effectively you engage your community. One effective way to engage your community is to work with your local school systems and the chamber of commerce at the same time. Students could take home a “broadband mapping” assignment for the family, while at the same time, the chamber could send out invitations to local businesses.
If your community engagement process is efficient, we can develop “high confidence data” for smaller communities in 2-3 weeks, and for larger communities in 4-6 weeks. Tier I cities, regional or statewide mapping takes longer. However, when we fully understand all your requirements, we will give you a time and cost estimate.
Inclusive Digital Design for Urban Areas
Our GIS based design tool, gives us the ability to focus in on areas of your city or its neighborhoods, which are under-served or have no connectivity at all. iNeighborhoods will port your specific community data into our GIS based network design tool which will provide business model options and a cost estimate for hybrid fiber-wireless, wireless, IoT or Geozone digital community options. In addition, our GIS based design tool gives provides you with cost effective, quick turnaround network design, business model options and a budgetary parts list, at a fraction of the cost of traditional methods. Say goodbye to traditional feasibility studies and long approval processes!
Digital Mapping Deliverables
An online representation of your community mapping data via Google Maps, and a CSV file, (see below) and a copy of your Internet performance test results.
For more information about digital mapping, or digital design solutions for urban areas, please reach out to us HERE.
| Timestamp | Date/time test was completed |
| IP | IP address of the customer’s access point |
| ASN | Autonomous System number |
| ispinfo | Name of the Isp |
| dl | dowload speed |
| ul | upload speed |
| ping | average time (milliseconds) to get to and from the test management server |
| jitter | frame error rate |
| latitude | latitude of address |
| longitude | longitude of address |
| blockid | census block group # |
| repeats | how many times this location has tested |
| cost | cost, if entered of service |
| mcc | Country code if cellular |
| mnc | Specific id of ISP if cellular |
| would pay | if no service, what would they pay |
| nsvc options | if no service, other options |
| other | if no service, comments if any |
| township | census township |
| county | census county |
| email address, if provided | |
| district | state legislative district if available |